
Menu
Tuesday 01 July 2025
Weekly Market Update
Overview
Global markets delivered a mixed performance during the last week, as cautious optimism over trade progress was tempered by rising geopolitical tensions. In North America, U.S. equities rallied strongly, with the S&P 500 gaining 1.54% on optimism surrounding U.S.–China trade negotiations and softer inflation data, reinforcing expectations for a Federal Reserve rate pause and potential cuts later this year. European markets edged lower amid escalating Middle East conflict and trade uncertainties, though the UK’s FTSE 100 briefly touched record highs before retreating. Japan’s equity market posted modest gains despite a stronger yen and geopolitical headwinds, as investors digested the Bank of Japan’s cautious policy tone. In China, gains were limited but supported by aggressive liquidity injections from the PBOC, with sentiment restrained by ongoing trade frictions and pre-leadership meeting caution. Indian equities experienced heightened volatility, driven by oil price spikes, Middle East tensions, and domestic headwinds such as the Air India aviation tragedy. MENA markets declined amid geopolitical instability and surging crude prices, though capital markets remained active with Dubai’s REIT listing and Saudi IPO momentum. In commodities, oil surged on supply concerns while gold held firm near $3,420 amid safe-haven demand. Currency markets reflected a risk-off tone, with the U.S. Dollar Index rebounding 0.4% and the euro climbing to its highest level since mid-2023 on hawkish ECB signals.
The Week Ahead:
Mon: No major scheduled economic data releases.
TUE: U.S. ISM Manufacturing Index (June) — key indicator of manufacturing sector health.
WED: U.S. Federal Budget Balance (June) — insights into fiscal health
THU: India, S&P Global Services PMI (June) — manufacturing sector activity.
FRI: UK, Manufacturing PMI (June) — manufacturing sector activity.
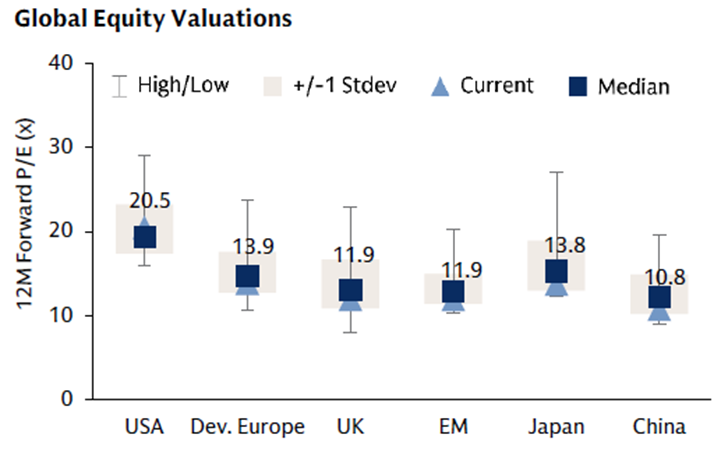
Outlook: The tug-of-war between global economic growth and inflation appears to have reached a more feasible balancing point. Across equity markets, the narrowing of the gulf between growth and value is likely to continue as a greater number of industries start to benefit from higher earnings and improving monetary and fiscal policies. 2025 likely will not be a year of robust economic (GDP growth: U.S. growth is forecast to grow at a modest 1.5%-2.5%, with the Eurozone and Chinese growth lagging. In this environment, investors could benefit from an increased allocation towards value names whilst avoiding an overexposure to growth. Nonetheless, we continue to buy high-quality, profitable, blue-chip equities with strong balance sheets and positive free-cashflow yields. Fixed-income securities also offer attractive yields at these levels, without subjecting portfolios to much downside risk. Emerging market equities and small companies are also available at attractive valuations relative to US Blue Chips. The overall outlook for equities remains cautiously optimistic, supported by a more dovish US Federal Reserve and a resilient US economy, though global risks and sector-specific performance will be closely watched.
Asset class forecasts*
[wpdatatable id=14]
*Source: Goldman Sachs (GS) Global Investment Research and GSAM as of January 2021.
Developed Markets
North America
U.S. equities delivered strong performance during the last week, with the S&P 500 up 1.54%, the Nasdaq 100 rising 2.00%, and the Russell 2000 gaining 3.23%. Investor sentiment improved on the back of progress in U.S.–China trade negotiations held in London, where preliminary agreements on rare earth exports and student visa policies helped ease bilateral tensions. Although markets briefly reacted to reports of Israeli airstrikes on Iranian infrastructure—pushing crude oil prices nearly 10% higher—stocks remained resilient, supported by softer inflation data (May CPI and core CPI both rose just 0.1%), reinforcing expectations that the Fed will maintain rates at 4.25%–4.50% in the upcoming June 17–18 meeting, with a potential cut later this year. While President Trump’s renewed tariff threats sparked some volatility, markets largely focused on improving trade momentum and are now looking ahead to the Fed’s policy guidance and Chair Powell’s remarks for further direction.
Europe & UK
European equity markets ended the last week, with modest declines as persistent geopolitical tensions and trade uncertainty weighed on investor sentiment. The pan-European STOXX 600 slipped 0.1%, Germany’s DAX fell 0.3%, and France’s CAC 40 dipped 0.2%, while the UK’s FTSE 100 remained relatively flat, edging up 0.02%. The FTSE briefly approached record levels early in the week before retreating amid renewed Middle East tensions following Israeli airstrikes on Iranian infrastructure. UK equities were partially supported by continued optimism around the UK–US Economic Prosperity Deal, which eased tariffs on select exports like steel and automobiles, though a 10% baseline tariff remains. The Bank of England’s earlier 25 bps rate cut to 4.25% in May continued to shape market expectations, particularly as policymakers flagged risks from global trade disruptions. Rising oil prices driven by geopolitical escalation pressured broader European indices by week’s end, with travel and leisure stocks underperforming, while energy, defense, and precious metals sectors gained. Looking ahead, markets will monitor UK–US trade developments, central bank signals, and the broader impact of geopolitical uncertainty on sector performance.
Japan
Japanese equity markets delivered a mixed performance during the last week, with the Nikkei 225 briefly surpassing the 38,000 mark on strong foreign inflows and continued strength in semiconductor and tech stocks like Advantest, before paring gains due to a stronger yen and renewed geopolitical tensions in the Middle East, ultimately ending the week up around 1.3%. Revised Q1 GDP data showed a milder contraction of -0.2% annualized (vs. -0.7% previously), and industrial production presented a mixed picture—down 1.1% month-over-month but up 0.5% year-over-year—indicating gradual recovery. Inflation remained elevated, with April CPI at 3.6%, above the BOJ’s 2% target. At its June 16–17 meeting, the Bank of Japan held rates steady at 0.5%, reaffirmed its bond tapering plan through March 2026, but signaled a slower pace thereafter to ease long-dated yield volatility. Governor Ueda reiterated the possibility of further rate hikes if inflation stabilizes near target, though market expectations suggest tightening may not occur until Q1 2026. Meanwhile, domestic policy discussions focused on ¥30,000–40,000 cash handouts to support households amid persistent price pressures, a politically sensitive move ahead of the upcoming upper house election. Going forward, Japan’s market trajectory will depend on the BOJ’s gradual policy shift, yen fluctuations, and the broader geopolitical and trade environment.
Emerging Markets
China
Chinese equity markets delivered a muted yet cautiously positive performance during the last week, with the CSI 300 rising around 0.8% midweek on modest progress in U.S.–China trade negotiations, particularly a preliminary framework on rare earth exports. However, gains were capped by persistent skepticism over implementation and lingering tariff concerns. The Shanghai Composite and Shenzhen Component also reflected this cautious optimism, supported by continued central bank liquidity support but tempered by profit-taking and geopolitical uncertainty. The People’s Bank of China maintained its accommodative stance, injecting ¥400 billion via six-month reverse repos during the week, following earlier liquidity infusions, while holding the seven-day reverse repo rate steady at 1.50%—signaling ongoing flexibility. The PBOC also urged banks to increase lending to priority sectors such as consumption, trade, and small businesses to sustain economic momentum. Domestic sentiment remained steady but range-bound, as investors weighed the effectiveness of stimulus measures against structural challenges in the property sector and ongoing global tensions. Looking ahead, markets will closely monitor the anticipated leadership talks between Presidents Trump and Xi, potential new policy signals from the upcoming Lujiazui Forum, and how the PBOC navigates the dual mandate of fostering growth while ensuring financial stability.
India
Indian equity markets witnessed heightened volatility during the last week, as a combination of global geopolitical tensions and domestic factors weighed on sentiment. The BSE Sensex declined by approximately 0.7% to close at 81,118.60, while the Nifty 50 fell 0.68% to 24,718.60, with midweek losses accelerating after a sharp sell-off—over 823 points on the Sensex—triggered by the escalating Israel–Iran conflict and a spike in crude oil prices. Sectors such as IT, energy, PSU banks, and FMCG led Thursday’s decline, further pressured by risk aversion ahead of the weekly F&O expiry. Rising tensions with Pakistan also dampened risk appetite, despite a brief ceasefire easing immediate concerns. Global trade uncertainty persisted amid unresolved U.S.–China tariff issues, while domestically, surging oil prices intensified inflationary pressures across key sectors, including aviation—already under strain following a tragic Air India crash near Ahmedabad. However, markets staged a strong rebound on Monday, with the Sensex gaining 0.84% to 81,796 and the Nifty rising 0.92% to 24,946, supported by easing oil prices and renewed optimism around global trade dialogue. Looking ahead, market direction will hinge on the evolution of geopolitical risks, particularly in the Middle East and South Asia, oil price movements, and progress in global trade negotiations.
MENA
Equity markets across the MENA region experienced notable volatility during the last week, driven by escalating geopolitical tensions following Israeli airstrikes on Iran. The Dubai Financial Market General Index (DFMGI) declined around 1.5%, with a sharp Friday sell-off led by real estate names like Emaar Properties and Emaar Development, despite early-week optimism on progress in U.S.–China trade talks. Abu Dhabi’s market showed relative resilience, posting modest gains on Monday supported by strength in energy stocks. In Saudi Arabia, the Tadawul All Share Index (TASI) dropped approximately 1.3%, pressured by declines in Al Rajhi Bank and Saudi Aramco amid rising risk aversion and profit-taking. Regional performance was mixed—Qatar’s index slid 2.9% on Sunday due to heightened conflict concerns, while Kuwait and Egypt also ended the week lower. Crude oil prices surged 6–7% on elevated geopolitical risk premiums, and gold rose about 3.5% on increased safe-haven demand. Regional bond yields edged higher, and currencies—including the Israeli shekel—faced downward pressure. Despite the volatility, capital markets activity remained strong: Dubai Residential REIT listed on the DFM as one of the largest REITs in the region, and Saudi Arabia’s IPO pipeline continued to attract investor interest. On the macro front, the UAE’s latest GDP print reinforced expectations for 4–4.5% non-oil growth in 2025. Looking ahead, markets will closely monitor geopolitical developments, oil prices, and global trade dynamics, while robust IPO activity and steady monetary policy may provide a cushion for investor sentiment.
Commodities and Forex
Commodities
Oil prices surged sharply during the last week, driven by intensifying Middle East tensions following Israeli airstrikes on Iranian targets, with Brent crude futures climbing approximately 7% to close at $74.23 per barrel, up from $69.36 the previous week. U.S. West Texas Intermediate (WTI) posted comparable gains, ending the week around $72.98, as fears of potential supply disruptions—particularly through the vital Strait of Hormuz—elevated risk premiums across energy markets. Although earlier expectations pointed to a possible output increase from OPEC+, geopolitical risks ultimately overshadowed supply-demand fundamentals and became the dominant driver of price movements. In parallel, gold prices continued their ascent as investors sought safe-haven assets amid heightened uncertainty, with the metal trading in a volatile range before settling near $3,420 per ounce, having fluctuated between $3,385 and $3,435. The rally in gold was underpinned by rising geopolitical risk, investor caution over mixed inflation readings, and a cautious tone from the Federal Reserve, reinforcing its appeal as a defensive hedge in a turbulent macro environment.
Currencies
The U.S. Dollar Index (DXY) rebounded to approximately 98.18 during the last week, recovering about 0.4% after hitting a three-year low earlier in the week, as renewed safe-haven demand emerged following Israeli airstrikes on Iran. Despite the late-week bounce, the dollar still posted a monthly decline of roughly 2.8%, pressured by softer U.S. inflation data and growing market expectations for Federal Reserve rate cuts later this year. In contrast, the euro continued to strengthen, trading between $1.142 and $1.163 and closing the week near $1.155—its highest level since mid-2023. The euro’s rally was supported by reduced dollar pressure, hawkish comments from ECB Vice President de Guindos emphasizing inflation control, and increasing expectations that the European Central Bank may pause further rate cuts in the near term.
Commodities
| Name | 20/06/25 | 31/05/25 | 31/03/25 | 31/12/24 |
|---|---|---|---|---|
| WTI Oil ($/barrel) | $74.93 | $60.79 | $71.48 | $71.72 |
| Brent Oil ($/barrel) | $77.01 | $63.90 | $74.74 | $74.64 |
| Gold ($/oz) | $3368.39 | $3289.25 | $3123.57 | $2624.50 |
| Natural Gas ($/mmBtu) | $3.85 | $3.45 | $4.12 | $3.63 |
Currency
| Name | 20/06/25 | 31/05/25 | 31/03/25 | 31/12/24 |
|---|---|---|---|---|
| Euro (€/$) | 1.1523 | 1.1347 | 1.0816 | 1.1041 |
| Pound (£/$) | 1.3451 | 1.3459 | 1.2516 | 1.2746 |
| Japanese Yen (¥/$) | 146.09 | 144.02 | 157.20 | 141.02 |
| Swiss Franc (CHF/€) | 0.9426 | 0.9333 | 0.9401 | 0.9289 |
| Chinese Yuan Renminbi (CNY/$) | 7.1815 | 7.1989 | 7.2993 | 7.0842 |
Index Valuations
Index Return
| Equities | 1 Week | MTD | QTD | YTD |
|---|---|---|---|---|
| S&P 500 | -0.12% | 1.05% | 6.68% | 2.12% |
| NASDAQ Composite | 0.22% | 1.80% | 12.61% | 1.06% |
| DJ Industrial Average | 0.07% | -0.01% | 0.94% | 0.06% |
| S&P 400 | 0.65% | 0.92% | 3.97% | -2.38% |
| Russell 2000 | 0.44% | 2.18% | 5.15% | -4.82% |
| S&P 500 Equal Weight | 0.21% | 0.68% | 2.65% | 2.03% |
| STOXX Europe 50 (€) | -1.02% | -2.40% | 1.80% | 9.61% |
| STOXX Europe 600 (€) | -1.50% | -2.11% | 2.34% | 8.41% |
| MSCI EAFE Small Cap | -0.55% | 0.42% | 12.33% | 16.64% |
| FTSE 100 (£) | -0.80% | 0.14% | 3.25% | 9.56% |
| FTSE MIB (€) | -0.53% | -2.14% | 5.84% | 18.35% |
| CAC 40 (€) | -1.12% | -1.85% | -0.04% | 5.74% |
| DAX (€) | -0.70% | -2.70% | 5.36% | 17.29% |
| SWISS MKT (CHF) | -2.26% | -2.89% | -4.11% | 5.46% |
| TOPIX (¥) | 0.54% | -1.08% | 4.24% | -0.49% |
| Nifty 50 | 1.59% | 1.46% | 7.16% | 6.21% |
| Hang Seng (HKD) | -1.52% | 1.03% | 3.31% | 17.30% |
| MSCI World | -0.46% | 0.56% | 7.57% | 5.77% |
| MSCI China Free | -1.26% | 1.60% | -0.85% | 13.31% |
| MSCI EAFE | -1.45% | -0.90% | 8.61% | 16.28% |
| MSCI EM | 0.05% | 3.12% | 9.00% | 12.26% |
| MSCI Brazil (BRL) | 0.33% | 0.84% | 6.09% | 13.32% |
| MSCI India (INR) | 0.72% | 1.08% | 7.27% | 3.93% |
Fixed Income
| Name | 1 Week | MTD | QTD | YTD |
|---|---|---|---|---|
| Bloomberg US Aggregate | 0.26% | 0.49% | 0.16% | 2.95% |
| Bloomberg Euro Aggregate | -0.18% | 1.39% | 8.52% | 12.19% |
| Bloomberg US High Yield | 0.29% | 0.77% | 2.44% | 3.47% |
| Bloomberg Euro High Yield (€) | -0.06% | 0.12% | 1.66% | 2.21% |
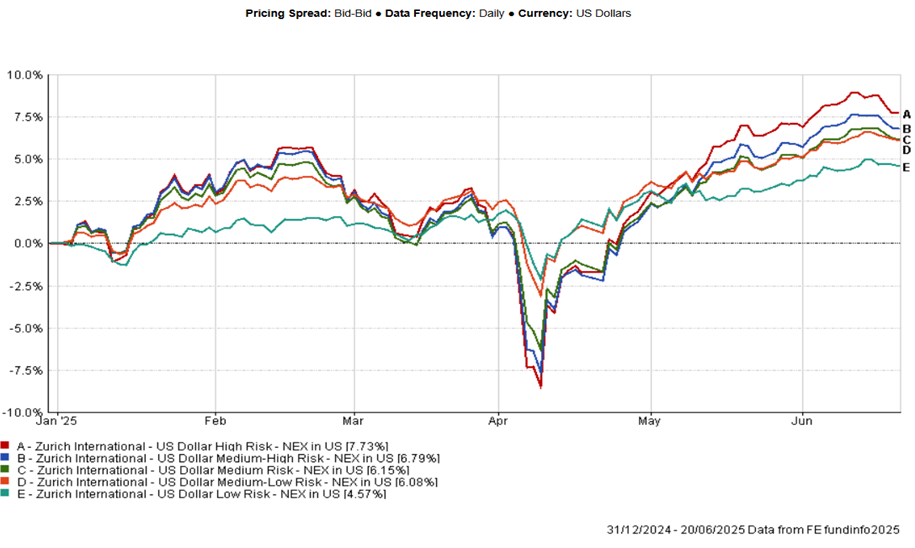
Blend Fund Performance Year To Date
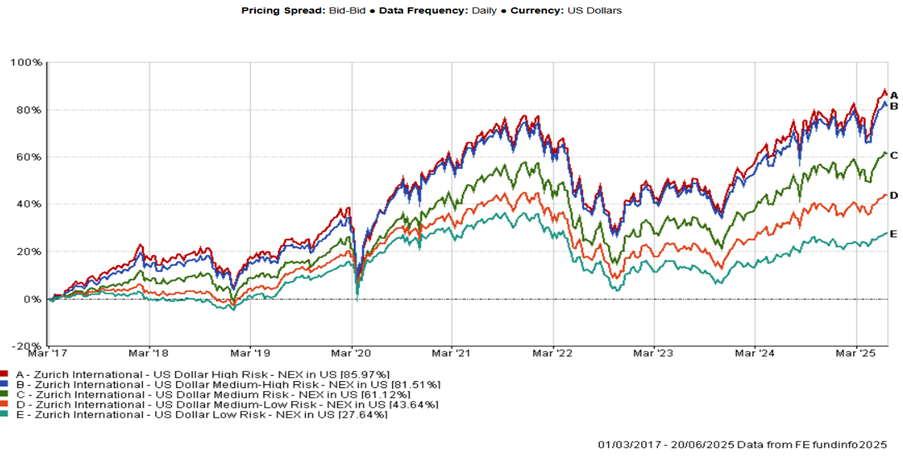
Blend Fund Performance Since Inception
Direct Fund
| (20/06/25) | 1 week % | 1 month % | 6 months % | YTD % | 1 year % | 2 years % |
|---|---|---|---|---|---|---|
| Aditum Global Discovery | -1.48% | 0.65% | 5.59% | 5.65% | 7.18% | 20.71% |
| Ashoka WhiteOak India Opportunities | -1.46% | -0.64% | -2.99% | -2.91% | 1.90% | - |
| BlackRock GF World Healthscience USD | -2.89% | -1.70% | -1.31% | -2.19% | -9.02% | 1.58% |
| Emirates Global Sukuk | 0.09% | 0.41% | 2.21% | 2.66% | 4.33% | 8.00% |
| Emirates MENA Fixed Income | -0.12% | 0.60% | 1.20% | 2.19% | 2.96% | 8.27% |
| Emirates MENA Top Companies | -4.24% | -5.45% | -5.01% | -4.92% | 1.99% | -3.69% |
| Franklin Gold and Precious Metals USD | -4.60% | 3.38% | 64.42% | 66.16% | 71.88% | 98.92% |
| Harris Associates Global Equity | -0.92% | -0.87% | 7.87% | 7.60% | 8.36% | 10.76% |
| Loomis Sayles Global Growth Equity | -1.39% | 0.71% | 6.05% | 7.95% | 20.56% | 39.01% |
| Loomis Sayles Multisector Income | 0.36% | 0.97% | 3.28% | 3.21% | 6.71% | 12.53% |
| PineBridge Japan Small Cap Equity | -1.99% | 0.40% | 14.48% | 13.67% | 12.03% | -0.07% |
| UBAM 30 Global Leaders Equity | -2.59% | -0.26% | 1.83% | 2.86% | 2.30% | 14.62% |
| iShares US Corporate bond Index | 0.10% | 1.26% | 2.91% | 2.71% | 4.87% | 10.25% |
| iShares Developed World Index | -0.47% | 0.42% | 5.17% | 5.27% | 11.90% | 36.19% |
Zurich Managed Funds
| (20/06/25) | 1 week % | 1 month % | 6 months % | YTD % | 1 year % | 2 years % |
|---|---|---|---|---|---|---|
| US dollar Adventurous | -1.99% | -0.18% | 5.59% | 5.63% | 6.41% | 24.89% |
| US dollar Performance | -0.99% | 1.05% | 3.30% | 3.41% | 6.20% | 22.65% |
| US dollar Blue Chip | -0.50% | 1.39% | 2.15% | 2.27% | 4.98% | 18.10% |
| US dollar Cautious | -0.23% | 1.40% | 2.07% | 2.16% | 4.16% | 12.55% |
| US dollar Defensive | -0.07% | 1.15% | 2.48% | 2.50% | 3.39% | 7.75% |
Zurich Mirror Funds
| (20/06/25) | 1 week % | 1 month % | 6 months % | YTD % | 1 year % | 2 years % |
|---|---|---|---|---|---|---|
| Canaccord Genuity Balanced | -0.56% | 1.08% | 2.90% | 2.75% | 4.14% | 14.59% |
| Canaccord Genuity Growth | -0.74% | 1.13% | 2.59% | 2.26% | 3.93% | 15.88% |
| Canaccord Genuity Opportunity | -0.70% | 1.13% | 4.12% | 3.83% | 6.49% | 22.28% |
| Emirates Emerging Market Debt | -0.22% | 1.49% | 0.59% | 0.74% | 5.37% | 11.95% |
| Emirates Islamic Balanced Managed | -0.25% | 0.91% | 2.05% | 2.55% | 3.55% | 12.67% |
| Loomis Sayles US Growth Equity | -1.03% | 2.05% | -0.39% | 0.09% | 14.81% | 45.05% |
* Data is lagged by 1 day.
** Data is lagged by 2 days.