Wednesday 6th May 2026
Weekly Market Update
Overview
Last week, global markets posted broadly positive performance despite geopolitical tensions in the Middle East, a more hawkish Federal Reserve tone, and volatility in commodities and currencies. US equities led gains, with the S&P 500 Index rising strongly in April on robust earnings, especially in AI-driven names like Alphabet Inc., while Meta Platforms lagged due to higher investment spending; however, higher Treasury yields weighed on bonds and credit markets. Europe ended largely flat as gains in Germany and Italy were offset by weakness in France and the UK, with the ECB holding rates steady but flagging growth risks amid elevated energy prices and weak sentiment. Japan saw mixed equity performance, with a stronger TOPIX versus the Nikkei 225, while a sharp yen rebound driven by suspected intervention and a hawkish Bank of Japan outlook signalled tightening policy expectations. In emerging markets, China was stable on improved sentiment following a Moody’s outlook upgrade and strong industrial profit growth, while Hong Kong lagged, and India declined sharply as Brent crude surged above $124, driving inflation concerns, rupee weakness, and FII outflows. MENA markets were mixed, supported by higher oil prices but constrained by geopolitical uncertainty. Commodities remained volatile, led by oil strength on supply concerns before profit-taking, while currencies saw the yen as the key mover, with EM currencies weakening under oil and outflow pressures.
The Week Ahead
Wed: U.S. ADP Nonfarm Employment Change (Apr): Measures the monthly change in private-sector jobs, giving an early signal of U.S. employment trends.
Thu: U.S. | Initial Jobless Claims: Measure the number of people who filed for unemployment benefits for the first time in a given week, serving as a leading indicator of labour market health.
Fri: U.S. | Unemployment Rate (Apr): Reports the percentage of the labor force that is unemployed, indicating the overall health of the U.S. job market.
Outlook: As 2026 progresses, the balance between global growth and inflation has improved, allowing central banks such as the Federal Reserve and European Central Bank to gradually shift from restrictive policy toward measured easing, supporting financial conditions and risk assets. We continue to favour equities, particularly high-quality, cash-generative large caps with resilient earnings, whilst maintaining fixed income as a core portfolio anchor given still-attractive yields and diversification benefits. Opportunities are also emerging in emerging markets and smaller-cap equities, where valuations remain compelling relative to developed market peers. However, geopolitical risks remain a key swing factor for markets, particularly developments involving Iran, tensions impacting global energy supply routes such as the Strait of Hormuz, and broader US-China dynamics, all of which could drive volatility in oil prices, inflation expectations and risk sentiment. Overall, the outlook for the remainder of 2026 remains cautiously constructive, supported by strong earnings and resilient fundamentals, but with heightened sensitivity to geopolitical developments.
Asset class forecasts*
Developed Markets
North America
Last week, global markets posted strong gains despite conflicting headlines around Middle East tensions and a more hawkish-than-expected Federal Reserve tone, with the S&P 500 Index rising over 10% in April—its best monthly performance since November 2020. Large-cap stocks outperformed small caps, while value led growth, supported by a sharp rise in oil prices that boosted the energy sector, with West Texas Intermediate ending the week up more than 7% amid volatility. Earnings season was a key driver, with broadly strong results from over half of S&P 500 companies offsetting concerns about inflationary pressures from higher commodities. Among the “Magnificent Seven,” Alphabet Inc. surged on strong AI and cloud demand, while Meta Platforms declined after increasing AI spending and issuing $25 billion in bonds. On the policy front, the Federal Open Market Committee held rates steady but surprised markets with a hawkish tilt, as three members dissented against the easing bias and one supported a rate cut—the highest under Jerome Powell—while Powell also signalled he may remain on the Fed Board after his chair term, adding uncertainty. Treasury yields moved higher, pressuring investment-grade bonds, and heavy issuance weighed on credit markets, though sentiment improved late in the week, supporting a recovery in high-yield bonds as risk appetite returned.
Europe & UK
Last week, European markets were broadly flat, with the STOXX Europe 600 Index edging up just 0.10% as positive earnings momentum was offset by geopolitical tensions, including stalled U.S.–Iran negotiations and the continued closure of the Strait of Hormuz, which kept oil prices elevated and sentiment cautious. Among major indices, Germany’s DAX gained 0.68% and Italy’s FTSE MIB rose 1.24%, while France’s CAC 40 fell 0.53% and the UK’s FTSE 100 Index was slightly lower by 0.04%, with most exchanges closed for International Workers’ Day except London. The European Central Bank held its deposit rate steady at 2% but flagged rising risks to growth due to Middle East tensions and even discussed the possibility of future rate hikes. Economic data showed weakness, with the eurozone Economic Sentiment Indicator falling to 93.5—it’s lowest since 2020—driven by weak consumer confidence, though industrial and construction activity remained relatively resilient. In Germany, inflation rose to 2.9% year-over-year, mainly due to energy costs, while Spain’s unemployment increased to 10.83% in Q1 2026, despite remaining lower year-on-year. In the UK, the Bank of England kept rates at 3.75%, citing uncertainty over energy prices and rising inflation at 3.3%, while weak demand was reflected in retail sales hitting their lowest level since 1983 according to the Confederation of British Industry.
Japan
Last week, Japanese equity markets delivered mixed performance, with the Nikkei 225 declining 0.34% while the broader TOPIX gained 0.33%, as currency volatility and shifting monetary policy expectations drove sentiment. The Japanese yen strengthened sharply from multi-decade lows, moving from around 160 to 156.7 against the U.S. dollar, a move widely attributed to suspected intervention after officials signalled concern when the currency breached the key 160 level. On the policy front, the Bank of Japan kept its benchmark rate unchanged at 0.75% but delivered a hawkish message, with a 6–3 split showing rising support for further rate hikes and policy normalization. Governor Kazuo Ueda highlighted growing uncertainty, noting inflation pressures from supply shocks linked to Middle East tensions while growth remains weak, creating a difficult policy balance. Reflecting this, the BoJ raised its FY2026 inflation forecast to 2.8% while cutting its growth forecast sharply to 0.5%, pointing to a stagflation-like environment. Meanwhile, Japanese government bond yields rose, with the 10-year yield reaching 2.50%, as markets increasingly priced in tighter monetary policy ahead.
Emerging Markets
China
Last week, mainland Chinese equities remained broadly stable during the holiday-shortened period, supported by improved sentiment after Moody’s Investors Service revised China’s sovereign outlook to “stable” from “negative” while maintaining its A1 rating. The CSI 300 Index rose 0.80% through Thursday, while the Shanghai Composite posted similar gains, whereas Hong Kong’s Hang Seng Index fell 0.78% amid weaker offshore sentiment ahead of the Labor Day break. Moody’s highlighted China’s macro resilience, citing strong domestic savings, low interest rates, and a diversified economy as buffers against rising debt and external pressures, while the government reiterated its focus on economic restructuring and fiscal sustainability. The Politburo signalled continued targeted support rather than broad stimulus, emphasizing domestic demand, employment, energy security, and AI-driven industrial upgrading alongside technological self-reliance. Industrial profits strengthened further, rising 15.8% year-over-year in March and 15.5% in Q1—the fastest pace since 2017—led by high-tech manufacturing and AI-related sectors, though rising input costs continued to highlight uneven recovery across the broader economy.
India
Last week, Indian equity markets erased earlier gains as rising crude oil prices, currency weakness, and foreign investor outflows weighed heavily on sentiment, with the Nifty 50 falling 1.56% and the S&P BSE Sensex declining 0.75% on April 30, 2026. A sharp surge in oil prices, with Brent Crude Oil crossing $124 per barrel, raised concerns over inflationary pressure, import costs, and widening current account stress for India, while the rupee’s sharp depreciation added further macroeconomic strain. Sentiment was also hurt by strong foreign institutional investor (FII) outflows and a rise in volatility, with the India VIX increasing by around 0.87%, signalling heightened market uncertainty. Broader indices also closed lower, with the Nifty 500 down 1.34% and the Nifty 100 falling 1.71%, while midcaps saw relative resilience as the Nifty Midcap 150 declined 0.86% and the Nifty Small Cap 250 edged up 0.29%.
MENA
Last week, MENA equity markets ended largely mixed, with sentiment supported by resilient corporate earnings and stable macro signals but capped by geopolitical tensions and elevated oil prices. In the Gulf, most indices saw mild gains as Saudi Arabia and Qatar benefitted from selective buying in energy and banking names, while the UAE markets came under pressure due to volatility in banking and real estate stocks. Regional performance was heavily influenced by oil market dynamics, with higher crude prices supporting energy-linked sectors but also raising concerns about inflation and fiscal pressures across import-dependent economies. Investor sentiment remained cautious amid ongoing Middle East geopolitical risks, including uncertainty around Iran-related developments and the Strait of Hormuz, which kept risk appetite subdued. Overall, while fundamentals such as strong sovereign balance sheets and solid earnings in select sectors provided support, broader gains were limited by external shocks and cautious global positioning in emerging markets.
Commodities and Forex
Commodities
Last week, global commodities markets were highly volatile, with strong geopolitical and macroeconomic drivers dominating price action across energy, metals, and precious resources. Oil remained the key focus, as escalating Middle East tensions and disruptions around the Strait of Hormuz kept supply concerns elevated, pushing Brent Crude Oil sharply higher at times above $124 per barrel before volatile swings triggered profit-taking later in the week. The surge in crude prices reinforced inflation fears globally and added pressure on import-dependent economies, while also influencing central bank expectations around “higher for longer” interest rates. Gold and other precious metals were mixed, with safe-haven demand supported by geopolitical uncertainty but offset by stronger US dollar dynamics and shifting rate expectations, leading to choppy performance in Gold and silver. Industrial metals showed relative resilience, supported by structural demand themes such as AI-driven infrastructure and electrification, although sentiment varied with global growth concerns. Overall, commodity markets reflected a tug-of-war between geopolitical risk premiums (especially oil supply concerns) and macro headwinds from tighter financial conditions, resulting in a broadly volatile but directionally inflationary environment across the asset class.
Currencies
Last week, currency markets were volatile amid geopolitical tensions, rising oil prices, and shifting central bank expectations, with the Japanese yen being the key highlight as it strengthened sharply from multi-decade lows after suspected official intervention, pushing USD/JPY from around 160 toward the mid-155–156 range. The US dollar traded mixed—initially supported by safe-haven demand and a hawkish Federal Reserve tone but later easing as risk sentiment improved and commodity volatility stabilised. Other major currencies, including the euro, saw choppy movement as investors reacted to fluctuating global risk appetite and interest rate expectations. Meanwhile, emerging market currencies such as the Indian rupee remained under pressure due to surging crude oil prices and sustained foreign outflows, reflecting concerns over inflation and external balance risks. Overall, FX markets were largely driven by intervention flows, oil-linked pressures, and shifting global risk sentiment.
Source: Goldman Sachs Asset Management as at 20/06/2025. Past performance does not guarantee future results, which can fall as well as rise.
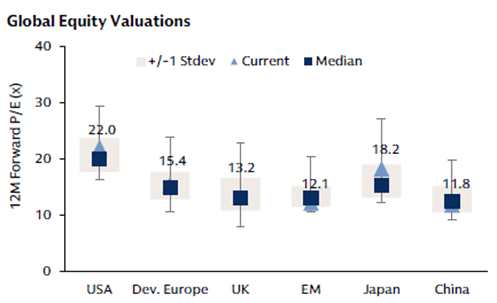
Chart Source: Goldman Sachs Asset Management and Bloomberg as of close of trading on May 30, 2025. Chart data shows next 12-month P/E ratio from January 2015 to the current period. 12m forward P/E(x) refers to price-to-earnings ratio for the next 12 months, which is a valuation measure applied to respective broad equity indices. Please see additional disclosures at the end of this presentation.
Commodities
| Name | 01/05/26 | 30/04/26 | 31/03/26 | 31/12/24 |
|---|---|---|---|---|
| WTI Oil ($/barrel) | $101.94 | $105.07 | $101.38 | $71.72 |
| Brent Oil ($/barrel) | $108.17 | $114.01 | $118.35 | $74.64 |
| Gold ($/oz) | $4614.21 | $4617.85 | $4668.06 | $2624.50 |
| Natural Gas ($/mmBtu) | $2.78 | $2.77 | $2.88 | $3.63 |
Currency
| Name | 01/05/26 | 30/04/26 | 31/03/26 | 31/12/24 |
|---|---|---|---|---|
| Euro (€/$) | 1.1721 | 1.1731 | 1.1553 | 1.0354 |
| Pound (£/$) | 1.3583 | 1.3604 | 1.3227 | 1.2516 |
| Japanese Yen (¥/$) | 157.01 | 156.59 | 158.72 | 157.20 |
| Swiss Franc (CHF/€) | 0.9150 | 0.9165 | 0.9237 | 0.9401 |
| Chinese Yuan Renminbi (CNY/$) | 6.8281 | 6.8281 | 6.8944 | 7.2993 |
Index Valuations
Index Return
| Name | 1 Week (%) | Month-to-Date (%) | Quarter-to-Date (%) | Year-to-Date (%) |
|---|---|---|---|---|
| S&P 500 | 0.92% | 0.30% | 10.82% | 6.00% |
| NASDAQ Composite | 1.12% | 0.89% | 16.35% | 8.25% |
| DJ Industrial Average | 0.55% | -0.31% | 6.90% | 3.49% |
| S&P 400 | -0.03% | 0.01% | 7.87% | 10.56% |
| Russell 2000 | 1.00% | 0.46% | 12.80% | 13.84% |
| S&P 500 Equal Weight | 0.36% | -0.25% | 5.70% | 6.39% |
| STOXX Europe 50 (€) | 0.20% | 0.00% | 6.37% | 2.67% |
| STOXX Europe 600 (€) | 0.31% | 0.05% | 5.61% | 4.74% |
| MSCI EAFE Small Cap | 1.67% | 0.40% | 9.44% | 8.23% |
| FTSE 100 (£) | -0.14% | -0.14% | 2.14% | 5.64% |
| FTSE MIB (€) | 1.24% | 0.00% | 9.56% | 8.46% |
| CAC 40 (€) | -0.17% | 0.00% | 4.44% | 0.29% |
| DAX (€) | 0.68% | 0.00% | 7.11% | -0.81% |
| SWISS MKT (CHF) | -0.25% | 0.00% | 4.15% | 1.63% |
| TOPIX (¥) | 0.33% | 0.04% | 6.60% | 10.52% |
| Nifty 50 | 0.42% | 0.00% | 7.49% | -7.95% |
| Hang Seng (HKD) | -0.78% | 0.00% | 4.06% | 0.96% |
| MSCI World | 0.93% | 0.29% | 9.96% | 6.15% |
| MSCI China Free | -1.59% | -0.01% | 2.51% | -7.72% |
| MSCI EAFE | 1.00% | 0.34% | 7.92% | 6.77% |
| MSCI EM | -0.52% | 0.08% | 14.83% | 14.70% |
| MSCI Brazil (BRL) | -1.56% | -0.03% | -0.19% | 14.20% |
| MSCI India (INR) | 0.41% | 0.00% | 9.24% | -5.63% |
Fixed Income
| Name | 1 Week (%) | Month-to-Date (%) | Quarter-to-Date (%) | Year-to-Date (%) |
|---|---|---|---|---|
| Bloomberg US Aggregate | -0.39% | 0.11% | 0.22% | 0.18% |
| Bloomberg Global Aggregate | 0.07% | 0.20% | 1.45% | 0.36% |
| Bloomberg Euro Aggregate | 0.36% | 0.32% | 2.60% | 0.02% |
| Bloomberg US High Yield | 0.05% | 0.14% | 1.83% | 1.33% |
| Bloomberg Euro High Yield (€) | -0.13% | 0.00% | 1.92% | 0.39% |
Blend Fund Performance (Year-to-Date)
Direct Fund
| (05/05/26) | 1 Week (%) | 1 Month (%) | 6 Months (%) | Year-to-Date (%) | 1 Year (%) | 2 Years (%) |
|---|---|---|---|---|---|---|
| Aditum Global Discovery | -0.35% | 6.34% | 8.41% | 2.38% | 23.89% | 30.94% |
| Aditum India Explorer Fund | 0.11% | 3.85% | -8.50% | -8.33% | -6.91% | - |
| Ashoka WhiteOak India Opportunities | -0.24% | 8.11% | -11.31% | -9.34% | -8.86% | -3.72% |
| BlackRock GF World Healthscience USD | 0.69% | -2.02% | 0.53% | -6.23% | 4.07% | 2.55% |
| Emirates Global Sukuk | -0.23% | 2.47% | -0.16% | -0.68% | 3.95% | 10.01% |
| Emirates MENA Fixed Income | -0.36% | 2.58% | -1.69% | -2.02% | 5.38% | 11.85% |
| Emirates MENA Top Companies | 0.80% | 3.27% | -0.03% | 3.39% | 3.36% | 7.36% |
| Franklin Gold and Precious Metals USD | -3.51% | -3.37% | 36.46% | 4.21% | 101.41% | 225.65% |
| Harris Associates Global Equity | 0.91% | 5.12% | 4.91% | -1.55% | 11.63% | 16.66% |
| Loomis Sayles Global Growth Equity | 0.86% | 9.79% | -6.26% | -4.70% | 9.57% | 29.32% |
| Loomis Sayles Multisector Income | -0.34% | 0.69% | 0.81% | -0.11% | 5.44% | 14.45% |
| Loomis Sayles US Growth Equity | 0.40% | 8.79% | -3.62% | -3.60% | 16.97% | 33.88% |
| PineBridge Japan Small Cap Equity | 2.74% | 2.93% | 18.06% | 13.47% | 25.83% | 37.18% |
| UBAM 30 Global Leaders Equity | -0.19% | 9.15% | 2.45% | 0.76% | 10.74% | 12.73% |
| iShares US Corporate bond Index | -0.25% | 0.27% | 0.80% | -0.09% | 6.10% | 11.85% |
| iShares Developed World Index | 1.03% | 8.18% | 7.63% | 5.01% | 26.66% | 42.20% |
Nexus Blend Funds
| (05/05/26) | 1 Week (%) | 1 Month (%) | 6 Months (%) | Year-to-Date (%) | 1 Year (%) | 2 Years (%) |
|---|---|---|---|---|---|---|
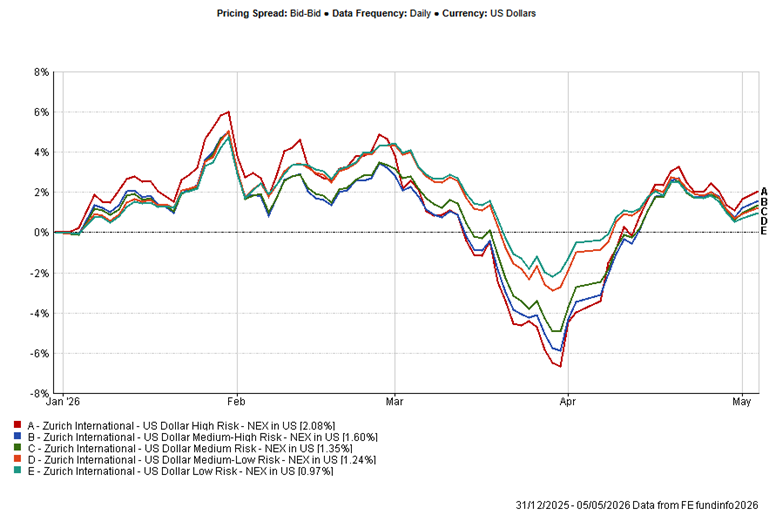
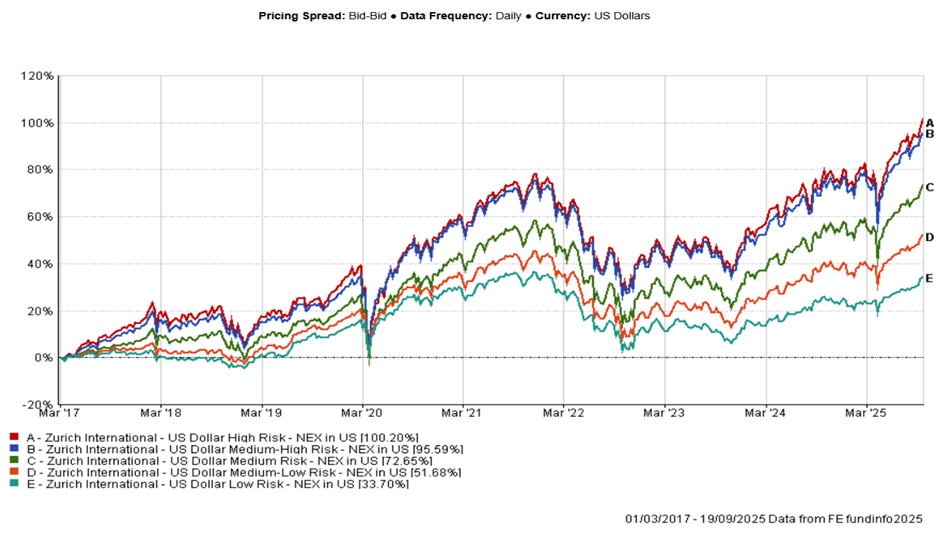
| US Dollar High Risk Blend | 0.00% | 6.29% | 4.62% | 2.08% | 20.66% | 33.18% |
| US Dollar Medium-High Risk Blend | -0.20% | 5.25% | 3.78% | 1.60% | 19.88% | 32.85% |
| US Dollar Medium Risk Blend | -0.35% | 4.18% | 3.42% | 1.35% | 17.74% | 30.26% |
| US Dollar Medium-Low Risk Blend | -0.52% | 2.23% | 3.53% | 1.24% | 14.55% | 25.88% |
| US Dollar Low Risk Blend | -0.57% | 1.48% | 3.11% | 0.97% | 12.14% | 21.54% |
Zurich Mirror Funds
| (05/05/26) | 1 Week (%) | 1 Month (%) | 6 Months (%) | Year-to-Date(%) | 1 Year (%) | 2 Years (%) |
|---|---|---|---|---|---|---|
| Canaccord Genuity Balanced | 0.02% | 4.66% | 3.52% | 2.39% | 14.06% | 19.17% |
| Canaccord Genuity Growth | -0.03% | 5.92% | 3.44% | 2.25% | 17.07% | 22.40% |
| Canaccord Genuity Opportunity | 0.31% | 5.75% | 6.77% | 4.68% | 21.31% | 28.81% |
| Emirates Emerging Market Debt | -0.32% | 2.75% | -0.48% | 0.56% | 7.19% | 15.04% |
| Emirates Islamic Global Balanced | -0.05% | 7.27% | 3.12% | 2.19% | 16.01% | 20.69% |
* Data is lagged by 1 day.
** Data is lagged by 2 days.