May 2026
Monthly Market Update
Overview
Outlook: As 2026 progresses, the balance between global growth and inflation has improved, allowing central banks such as the Federal Reserve and European Central Bank to gradually shift from restrictive policy toward measured easing, supporting financial conditions and risk assets. We continue to favour equities, particularly high-quality, cash-generative large caps with resilient earnings, whilst maintaining fixed income as a core portfolio anchor given still-attractive yields and diversification benefits. Opportunities are also emerging in emerging markets and smaller-cap equities, where valuations remain compelling relative to developed market peers. However, geopolitical risks remain a key swing factor for markets, particularly developments involving Iran, tensions impacting global energy supply routes such as the Strait of Hormuz, and broader US-China dynamics, all of which could drive volatility in oil prices, inflation expectations and risk sentiment. Overall, the outlook for the remainder of 2026 remains cautiously constructive, supported by strong earnings and resilient fundamentals, but with heightened sensitivity to geopolitical developments.
Developed Markets
China
Last week, Chinese markets ended lower as early optimism from the Trump-Xi summit and stronger-than-expected economic data faded later in the week. Mainland Chinese indexes posted modest declines, while Hong Kong equities underperformed due to continued caution around internet and export-related sectors. Investor sentiment was initially supported by signs of stable U.S.-China relations and resilient economic data, but markets lost momentum as the summit produced no major policy breakthroughs or rollback of trade restrictions. The meeting between Donald Trump and Xi Jinping reinforced expectations that both countries want to avoid further escalation in trade and technology tensions, helping limit downside risks for regional markets. Economic data also showed China’s services sector expanded faster than expected, supported by stronger domestic demand, although export orders remained weak. Inflation data surprised on the upside, with producer prices rising at the fastest pace since 2022 due to higher commodity and energy prices, while consumer inflation also strengthened modestly. Strong export and import growth further highlighted resilience in external demand and domestic activity, reducing expectations for additional large-scale monetary easing from Beijing in the near term.
India
Last week, Indian markets remained under pressure and ended lower due to broad-based selling across major sectors amid rising investor concerns over global macroeconomic conditions and increased market volatility. The Nifty 50 posted a sharp weekly decline, while broader markets including midcap stocks also weakened, indicating a wider risk-off sentiment among investors. Market volatility increased notably, with the India VIX rising sharply, reflecting higher investor anxiety and uncertainty. Defensive sectors such as pharma, healthcare, and metals outperformed and managed to post gains as investors shifted toward relatively safer areas of the market. On the other hand, growth-oriented and interest rate-sensitive sectors saw heavy selling pressure, with real estate, IT, consumer durables, and auto stocks leading the declines. Financials and oil & gas sectors also remained weak, while FMCG stocks were relatively stable compared to the broader market correction.
MENA
Last week, MENA markets remained relatively resilient despite rising geopolitical tensions and uncertainty surrounding the Strait of Hormuz, with investors closely monitoring oil prices, regional security developments, and global inflation concerns. Higher energy prices continued to support Gulf economies, particularly in the UAE and Saudi Arabia, while strong fiscal positions and ongoing economic diversification efforts helped maintain investor confidence across the region. Markets were also supported by expectations that GCC economies will continue to outperform many global peers due to robust non-oil growth, infrastructure investment, and strong banking sector fundamentals. However, concerns around regional conflict and trade disruptions kept volatility elevated, especially as tensions involving Iran and shipping routes in the Gulf remained in focus. Overall, sentiment in the region stayed cautiously optimistic, supported by resilient economic fundamentals despite short-term geopolitical risks.
Emerging Markets
China
Last week, Chinese markets ended lower as early optimism from the Trump-Xi summit and stronger-than-expected economic data faded later in the week. Mainland Chinese indexes posted modest declines, while Hong Kong equities underperformed due to continued caution around internet and export-related sectors. Investor sentiment was initially supported by signs of stable U.S.-China relations and resilient economic data, but markets lost momentum as the summit produced no major policy breakthroughs or rollback of trade restrictions. The meeting between Donald Trump and Xi Jinping reinforced expectations that both countries want to avoid further escalation in trade and technology tensions, helping limit downside risks for regional markets. Economic data also showed China’s services sector expanded faster than expected, supported by stronger domestic demand, although export orders remained weak. Inflation data surprised on the upside, with producer prices rising at the fastest pace since 2022 due to higher commodity and energy prices, while consumer inflation also strengthened modestly. Strong export and import growth further highlighted resilience in external demand and domestic activity, reducing expectations for additional large-scale monetary easing from Beijing in the near term.
India
Last week, Indian markets remained under pressure and ended lower due to broad-based selling across major sectors amid rising investor concerns over global macroeconomic conditions and increased market volatility. The Nifty 50 posted a sharp weekly decline, while broader markets, including midcap stocks also weakened, indicating a wider risk-off sentiment among investors. Market volatility increased notably, with the India VIX rising sharply, reflecting higher investor anxiety and uncertainty. Defensive sectors such as pharma, healthcare, and metals outperformed and managed to post gains as investors shifted toward relatively safer areas of the market. On the other hand, growth-oriented and interest rate-sensitive sectors saw heavy selling pressure, with real estate, IT, consumer durables, and auto stocks leading the declines. Financials and oil & gas sectors also remained weak, while FMCG stocks were relatively stable compared to the broader market correction.
MENA
Last week, MENA markets remained relatively resilient despite rising geopolitical tensions and uncertainty surrounding the Strait of Hormuz, with investors closely monitoring oil prices, regional security developments, and global inflation concerns. Higher energy prices continued to support Gulf economies, particularly in the UAE and Saudi Arabia, while strong fiscal positions and ongoing economic diversification efforts helped maintain investor confidence across the region. Markets were also supported by expectations that GCC economies will continue to outperform many global peers due to robust non-oil growth, infrastructure investment, and strong banking sector fundamentals. However, concerns around regional conflict and trade disruptions kept volatility elevated, especially as tensions involving Iran and shipping routes in the Gulf remained in focus. Overall, sentiment in the region stayed cautiously optimistic, supported by resilient economic fundamentals despite short-term geopolitical risks.
Commodities and Forex
Commodities
Last week, global commodity markets remained highly focused on Middle East tensions and disruptions to oil supply routes, particularly around the Strait of Hormuz, which continued to keep energy prices elevated and markets volatile. Oil prices stayed above the $100 per barrel level despite occasional declines driven by hopes of diplomatic progress between the U.S. and Iran. Investors remained concerned that prolonged conflict and supply disruptions could fuel global inflation, pressure central banks to maintain higher interest rates, and slow economic growth. Energy markets were further supported by falling global oil inventories and concerns from the International Energy Agency that commercial stockpiles are being depleted rapidly. At the same time, uncertainty around shipping routes, sanctions, and production losses across the Middle East continued to create volatility in commodities, freight, and broader financial markets. Overall, commodity markets remained cautious as investors balanced geopolitical risks against expectations for potential diplomatic negotiations and eventual stabilization in oil supply.
Currencies
Last week, global currency markets remained volatile as investors reacted to rising inflation concerns, elevated oil prices, and ongoing geopolitical tensions in the Middle East. The U.S. dollar stayed relatively strong against most major currencies as markets increasingly expected the Federal Reserve to keep interest rates higher for longer following hotter-than-expected U.S. inflation data. Meanwhile, the Japanese yen remained under pressure near key intervention levels despite repeated warnings and suspected market intervention by Japanese authorities, as the gap between U.S. and Japanese interest rates continued to weigh on the currency. The euro and British pound also faced pressure amid concerns that higher energy prices and slower economic growth could weaken Europe’s outlook. Across Asia, several currencies weakened due to rising oil import costs and capital outflows, while investors closely monitored developments around the Strait of Hormuz and U.S.-Iran negotiations for their impact on inflation, energy markets, and global risk sentiment. Overall, currency markets remained cautious, with safe-haven demand supporting the dollar while geopolitical uncertainty and inflation fears kept volatility elevated.
Commodities
| Name | 18/05/26 | 30/04/26 | 31/03/26 | 31/12/24 |
|---|---|---|---|---|
| WTI Oil ($/barrel) | $95.42 | $105.07 | $101.38 | $71.72 |
| Brent Oil ($/barrel) | $101.29 | $114.01 | $118.35 | $74.64 |
| Gold ($/oz) | $4715.25 | $4617.85 | $4668.06 | $2624.50 |
| Natural Gas ($/mmBtu) | $2.76 | $2.77 | $2.88 | $3.63 |
Currencies
| Name | 18/05/26 | 30/04/26 | 31/03/26 | 31/12/24 |
|---|---|---|---|---|
| Euro (€/$) | 1.1787 | 1.1731 | 1.1553 | 1.0354 |
| Pound (£/$) | 1.3631 | 1.3604 | 1.3227 | 1.2516 |
| Japanese Yen (¥/$) | 156.68 | 156.59 | 158.72 | 157.20 |
| Swiss Franc (CHF/€) | 0.9148 | 0.9165 | 0.9237 | 0.9401 |
| Chinese Yuan Renminbi (CNY/$) | 6.8005 | 6.8281 | 6.8944 | 7.2993 |
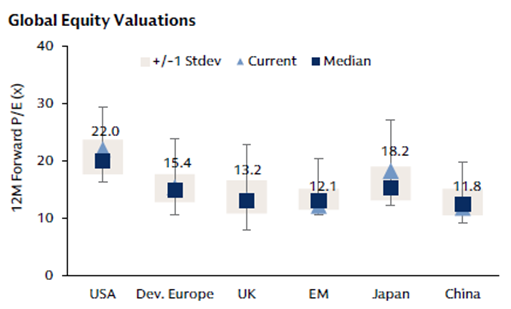
Index Valuations
Index Return
| Name | 1 Week (%) | Month-to-Date (%) | Quarter-to-Date (%) | Year-to-Date (%) |
|---|---|---|---|---|
| S&P 500 | 2.36% | 2.66% | 13.43% | 8.50% |
| NASDAQ Composite | 4.52% | 5.46% | 21.61% | 13.15% |
| DJ Industrial Average | 0.25% | -0.06% | 7.17% | 3.75% |
| S&P 400 | 1.67% | 1.67% | 9.67% | 12.40% |
| Russell 2000 | 1.73% | 2.20% | 14.76% | 15.81% |
| S&P 500 Equal Weight | 0.67% | 0.42% | 6.41% | 7.10% |
| STOXX Europe 50 (€) | 1.03% | 1.03% | 7.46% | 3.72% |
| STOXX Europe 600 (€) | 0.35% | 0.40% | 5.98% | 5.10% |
| MSCI EAFE Small Cap | 2.19% | 2.59% | 11.84% | 10.60% |
| FTSE 100 (£) | -1.22% | -1.36% | 0.89% | 4.35% |
| FTSE MIB (€) | 2.16% | 2.16% | 11.93% | 10.80% |
| CAC 40 (€) | 0.42% | 0.42% | 4.87% | 0.71% |
| DAX (€) | 0.19% | 0.19% | 7.31% | -0.62% |
| SWISS MKT (CHF) | -0.24% | -0.24% | 3.91% | 1.39% |
| TOPIX (¥) | 2.70% | 2.74% | 9.48% | 13.51% |
| Nifty 50 | 0.74% | 0.74% | 8.29% | -7.26% |
| Hang Seng (HKD) | 2.39% | 2.39% | 6.65% | 3.48% |
| MSCI World | 1.84% | 2.14% | 11.98% | 8.11% |
| MSCI China Free | 2.76% | 2.76% | 5.34% | -5.17% |
| MSCI EAFE | 1.10% | 1.44% | 9.10% | 7.94% |
| MSCI EM | 6.90% | 6.98% | 22.75% | 22.61% |
| MSCI Brazil (BRL) | -2.40% | -2.42% | -2.58% | 11.46% |
| MSCI India (INR) | 1.66% | 1.66% | 11.05% | -4.06% |
Nexus Blend Funds
| (18/05/26) | 1 Week (%) | 1 Month (%) | 6 Months (%) | Year-to-Date (%) | 1 Year (%) | 2 Years (%) |
|---|---|---|---|---|---|---|
| US Dollar High Risk Blend | -1.53% | 0.59% | 6.96% | 2.95% | 17.93% | 28.93% |
| US Dollar Medium-High Risk Blend | -1.19% | 0.64% | 5.75% | 2.49% | 17.51% | 28.71% |
| US Dollar Medium Risk Blend | -1.26% | 0.25% | 4.93% | 2.03% | 15.94% | 26.29% |
| US Dollar Medium-Low Risk Blend | -1.40% | -0.53% | 3.95% | 1.47% | 13.83% | 22.23% |
| US Dollar Low Risk Blend | -1.44% | -0.86% | 3.16% | 0.99% | 12.27% | 18.65% |
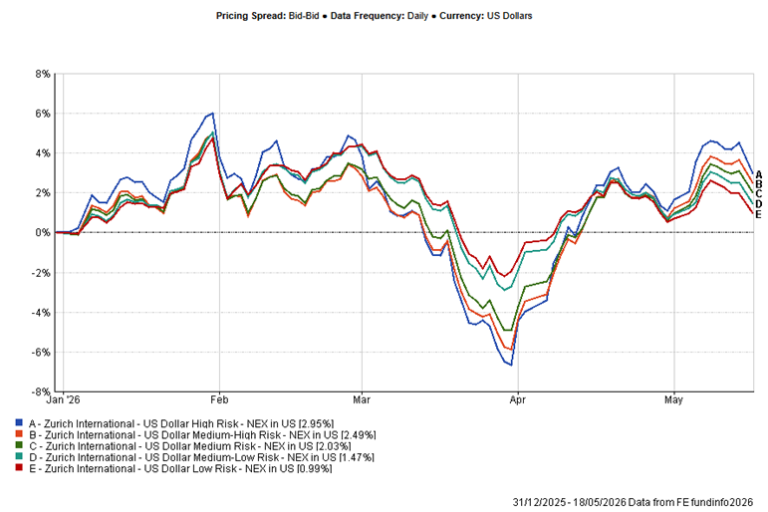
Blend Fund Performance (Year-to-Date)
Direct Fund Name
| (18/05/26) | 1 Week (%) | 1 Month (%) | 6 Months (%) | Year-to-Date (%) | 1 Year (%) | 2 Years (%) |
|---|---|---|---|---|---|---|
| Aditum Global Discovery | -1.54% | 0.27% | -1.66% | 8.33% | 2.98% | 22.07% |
| Aditum India Explorer Fund | -2.27% | -5.34% | -10.49% | -10.04% | - | - |
| Ashoka WhiteOak India Opportunities | -2.44% | -3.68% | -6.83% | -13.88% | -10.94% | -12.57% |
| BlackRock GF World Healthscience USD | 0.17% | -2.82% | -8.10% | -3.75% | -5.97% | 8.99% |
| Emirates Global Sukuk | -0.32% | -0.12% | -1.02% | -0.09% | -0.65% | 4.09% |
| Emirates MENA Fixed Income | -0.44% | -0.12% | -1.63% | -1.53% | -1.96% | 5.82% |
| Emirates MENA Top Companies | -1.81% | -4.43% | -6.61% | 0.17% | 0.91% | 0.48% |
| Franklin Gold and Precious Metals USD | -7.47% | -9.62% | -7.60% | 31.55% | 7.43% | 115.19% |
| Harris Associates Global Equity | 0.44% | -1.04% | -2.95% | 6.93% | -0.70% | 9.00% |
| Loomis Sayles Global Growth Equity | -2.38% | -0.32% | 1.93% | -4.51% | -5.98% | 2.57% |
| Loomis Sayles Multisector Income | -1.09% | -1.31% | -2.15% | -0.06% | -1.03% | 4.54% |
| Loomis Sayles US Growth Equity | -0.67% | 1.91% | 5.38% | 2.91% | -1.36% | 11.30% |
| PineBridge Japan Small Cap Equity | 1.50% | 6.62% | 4.10% | 25.39% | 19.54% | 28.50% |
| UBAM 30 Global Leaders Equity | 0.52% | 3.86% | 6.20% | 4.44% | 2.50% | 10.16% |
| iShares US Corporate bond Index | -0.84% | -1.36% | 0.09% | -0.66% | 5.43% | 10.39% |
| iShares Developed World Index | -0.47% | 2.13% | 12.09% | 6.94% | 23.81% | 39.98% |
Nexus Blend Funds
| (18/05/26) | 1 Week (%) | 1 Month (%) | 6 Months (%) | Year-to-Date (%) | 1 Year (%) | 2 Years (%) |
|---|---|---|---|---|---|---|
| US Dollar High Risk Blend | -1.53% | 0.59% | 6.96% | 2.95% | 17.93% | 28.93% |
| US Dollar Medium-High Risk Blend | -1.19% | 0.64% | 5.75% | 2.49% | 17.51% | 28.71% |
| US Dollar Medium Risk Blend | -1.26% | 0.25% | 4.93% | 2.03% | 15.94% | 26.29% |
| US Dollar Medium-Low Risk Blend | -1.40% | -0.53% | 3.95% | 1.47% | 13.83% | 22.23% |
| US Dollar Low Risk Blend | -1.44% | -0.86% | 3.16% | 0.99% | 12.27% | 18.65% |
Zurich Mirror Funds
| (18/05/26) | 1 Week (%) | 1 Month (%) | 6 Months (%) | Year-to-Date(%) | 1 Year (%) | 2 Years (%) |
|---|---|---|---|---|---|---|
| Canaccord Genuity Balanced | -0.46% | 2.12% | 6.10% | 4.08% | 13.29% | 17.07% |
| Canaccord Genuity Growth | -0.46% | 2.90% | 7.13% | 4.60% | 15.96% | 20.12% |
| Canaccord Genuity Opportunity | 0.11% | 4.11% | 11.13% | 7.88% | 21.48% | 27.81% |
| Emirates Emerging Market Debt | -0.55% | 0.23% | 0.64% | 1.06% | 8.00% | 12.05% |
| Emirates Islamic Global Balanced | 0.66% | 3.47% | 5.46% | 4.34% | 16.34% | 21.64% |
* Data is lagged by 1 day.
** Data is lagged by 2 days.