
Menu
Wednesday 3 September 2025
Weekly Market Update
Overview
Global markets were mixed as sentiment was influenced by central bank signals, geopolitical developments, and macro data. In North America, early optimism from Fed Chair Powell’s Jackson Hole speech on August 22, suggesting a dovish pivot amid cooling inflation while highlighting employment risks, set a positive tone. However, tech sector headwinds and China concerns weighed on markets, with the S&P 500 down 0.1% to 6,460, Nasdaq -0.2%, Dow -0.2%, and Russell 2000 showing resilience, gaining over 7% for August and outperforming the Nasdaq 100. Europe posted modest gains, with the STOXX Europe 600 +0.23%, DAX rebounding slightly, and FTSE 100 closing Friday down ~0.4% amid bank weakness; defence and energy stocks offered partial support. Japan’s Nikkei 225 fell ~0.2–0.3% as tech faced U.S. regulatory pressure, while 30-year JGB yields surged to ~3.22%. China’s CSI 300 rose ~2.5% for the week (~10% in August), driven by liquidity, retail and institutional flows, and bond-to-equity rotation. India’s Sensex/Nifty fell amid Reliance results — over August, FPIs withdrew ~$3.3B — while domestic institutions stabilized markets. MENA was mixed, with Saudi and Qatar down ~0.6%, Dubai +0.3%, Abu Dhabi +0.2%, and Egypt +0.9%. Oil rose modestly, gold remained firm, DXY fell ~0.73%, and EUR/USD rose to 1.1643. The week highlighted resilient U.S. small-caps and China, pressure on India and Japan, and sensitivity of commodities and currencies to central banks and geopolitical developments.
The Week Ahead
Mon: U.S., New Home Sales (July)
Tue: U.S., Durable Good Orders (MoM) (July)
Wed: U.S., Crude Oil Inventories
Thu: U.S., GDP (QoQ) (Q2)
Fri: U.S., Core PCE Price Index (MoM) (July)
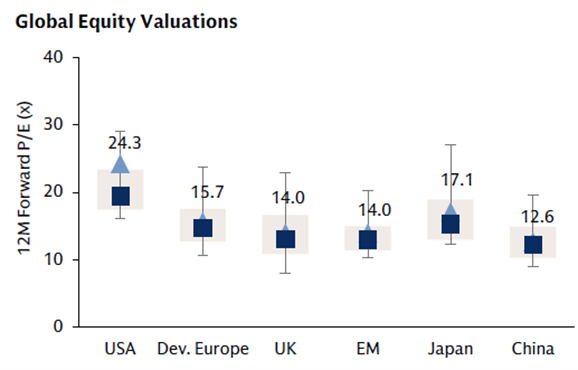
Outlook: The tug-of-war between global economic growth and inflation appears to have reached a more feasible balancing point. Across equity markets, the narrowing of the gulf between growth and value is likely to continue as a greater number of industries start to benefit from higher earnings and improving monetary and fiscal policies. 2025 likely will not be a year of robust economic (GDP growth: U.S. growth is forecast to grow at a modest 1.5%-2.5%, with the Eurozone and Chinese growth lagging. In this environment, investors could benefit from an increased allocation towards value names whilst avoiding an overexposure to growth. Nonetheless, we continue to buy high-quality, profitable, blue-chip equities with strong balance sheets and positive free-cashflow yields. Fixed-income securities also offer attractive yields at these levels, without subjecting portfolios to much downside risk. Emerging market equities and small companies are also available at attractive valuations relative to US Blue Chips. The overall outlook for equities remains cautiously optimistic, supported by a more dovish US Federal Reserve and a resilient US economy, though global risks and sector-specific performance will be closely watched.
Asset class forecasts*
[wpdatatable id=14]
*Source: Goldman Sachs (GS) Global Investment Research and GSAM as of January 2021.
Developed Markets
North America
US equity markets ended last week slightly lower after an initial boost from the Jackson Hole symposium (August 22), where Fed Chair Jerome Powell signalled a potentially more dovish approach in response to cooling inflation pressures, though he emphasized risks to employment and economic growth. Early optimism carried into Monday, August 25, but faded as tech sector headwinds and China-related concerns weighed on sentiment, with the S&P 500 sliding 0.4%, the Dow dropping 0.8%, the Russell 2000 falling 1.0%, and the Nasdaq down 0.2%, setting a cautious tone. Midweek, markets recovered modestly on the back of solid GDP revisions, easing inflation measures, and rotation into small-caps and cyclicals, with the Russell 2000 gaining over 7% for August and significantly outperforming the Nasdaq 100. By Friday, August 29, profit-taking and lingering global uncertainties pulled major indices back: the S&P 500 dropped ~0.6% to 6,460, the Nasdaq fell ~1.2%, and the Dow lost ~0.2%, while the Russell 2000 edged up ~0.2% for the week. Overall, the S&P 500 ended down ~0.1%, Nasdaq ~0.2%, and Dow ~0.2%, with small caps showing resilience. Year-to-date performance remained firmly positive, and investors remained focused on upcoming inflation data and the Fed’s policy trajectory amid historically volatile September expectations.
Europe & UK
European equities notched a modest gain by the week’s close, with the STOXX Europe 600 rising approximately 0.23% on Friday to ~551.43, extending the rally to its third consecutive weekly advance and finishing the month up around 0.74%. Sector-wise, defence-related stocks provided support amid easing trade tensions and some positive sentiment around U.S. tariff developments. Meanwhile, Germany’s DAX saw modest rebounds from earlier weakness, buoyed by broadly improving risk appetite—though specific daily moves weren’t detailed in recent summaries.
In the UK, the FTSE 100 continued its record-high streak from mid-week, peaking at a closing record of 9,321.40 (and intraday high of 9,357.51) on August 22. Over the week, the index was on course for a ~2% weekly gain, powered by strength in banks and energy; Standard Chartered notably gained following favourable U.S. court developments. However, momentum faltered by Friday, with the index falling ~0.4%, dragged lower by underperforming banking names such as NatWest, Lloyds, and Barclays amid tax proposal concerns.
Japan
Japanese equities retreated modestly amid global tech weakness and investor caution ahead of the Jackson Hole symposium—the Nikkei 225 dipped around 0.2–0.3%, reversing earlier record highs as technology-heavy segments were pressured by fears of U.S. regulatory intervention and slowing momentum. Meanwhile, long-dated bond yields surged, with the 30-year Japanese Government Bond (JGB) yield reaching multi-decade record levels near 3.215–3.22%, driven by rising U.S. Treasury yields, the Bank of Japan’s gradual exit from yield curve control, and concerns over Japan’s fiscal trajectory.
Emerging Markets
China
Chinese equities continued their strong rally into the final week of August, with the CSI 300 Index rising by about 1.8% on August 28 and gaining approximately 0.74% more on August 29, reaching around 4,496.8, according to historical data. The upward momentum through August reflects a broader ~10% gain for CSI 300 during the month, driven by robust liquidity flows, institutional and retail investor interest, and a shift from bonds to equities amid low bond yields. Wall Street heavyweights like Goldman Sachs and JPMorgan remain bullish, projecting further upside with year-end returns of 10–12% (Goldman on CSI 300) and even more optimistic forecasts up to 24% by 2026 (JPMorgan).
India
Indian equity markets faced renewed pressure in the week’s final stretch. The Sensex and Nifty dropped steadily, with a sharp sell-off on Thursday, August 28, as markets responded to newly imposed 50% U.S. tariffs on Indian exports, leading to net FPI outflows and declines across sectors. On Friday, August 29, both indices extended losses amid disappointing investor sentiment and underwhelming results from Reliance Industries, with the Sensex down another ~270 points and the Nifty falling below 24,450 Over August, FPIs pulled out approximately $3.3 billion, the largest monthly outflow since February, while domestic institutional investors helped stabilize markets somewhat.
MENA
By midweek (August 27), Gulf stock markets ended mixed amid renewed concerns over the U.S. Federal Reserve’s independence after a political confrontation surfaced, raising uncertainty about upcoming monetary policy—Saudi Arabia’s TASI dropped approximately 0.6% (weighed down by a 1% decline in Al Rajhi Bank and a 2.8% slide in Saudi National Bank), while Qatar’s QSI slipped about 0.6% as Qatar Islamic Bank fell around 1.6%. In contrast, Dubai’s DFMGI picked up ~0.3%, driven by a 1% gain in Emaar Properties, and Abu Dhabi’s index nudged up ~0.2%. Egypt’s EGX30 posted the strongest gain, climbing roughly 0.9%, led by a 4.1% rally in Eastern Company amid anticipation of a central bank rate cut to bolster growth as inflation eases. Earlier in the week on Monday (August 25), most Gulf markets also moved cautiously amid fading optimism over a potential U.S. rate cut—TASI slipped about 0.1%, QSI fell ~0.3%, while Dubai ticked up 0.1%, and Abu Dhabi ended flat. Egypt’s index remained flat on that day.
Commodities and Forex
Commodities
Global oil prices ended the week modestly higher, with Brent crude gaining about 0.6% and WTI rising approximately 0.8%, despite a Friday dip triggered by fading U.S. demand as the summer driving season wound down. Earlier in the week, Brent briefly climbed to two-week highs (~$68.64) and WTI to around $64.64, lifted by concerns over potential supply disruptions from escalating Russia–Ukraine tensions—even though OPEC+ maintained output increases. Looking ahead, Goldman Sachs projected that rising supply—driven by output ramp-ups—will depress Brent prices to the low-$50s per barrel by late 2026, though stronger Chinese stockpiling could elevate the average back to about $62.
Meanwhile, gold remained firm throughout the week, bolstered by safe-haven demand amid geopolitical and economic uncertainty. Analysts continued to endorse a “buy on dips” strategy, citing solid technical support and broader investor confidence in gold’s defensive appeal.
Currencies
The U.S. Dollar Index (DXY) experienced notable fluctuations during last week. On August 25, the DXY opened at 98.43 and closed at 97.72, reflecting a decline of approximately 0.73%. This downward movement was attributed to market reactions to Federal Reserve Chair Jerome Powell’s dovish remarks during the Jackson Hole symposium, which signalled a potential rate cut in September due to increasing risks to the job market, despite persistent inflation concerns. The DXY continued to fluctuate throughout the week, closing at 98.25 on August 27 and 98.47 on August 26, before settling at 98.23 on August 27.
In contrast, the EUR/USD exchange rate exhibited a different trend. On August 25, the EUR/USD rate was 1.1618, indicating a slight appreciation of the euro against the U.S. dollar. This movement was influenced by market expectations of a potential rate cut by the Federal Reserve, which could weaken the U.S. dollar and make the euro more attractive to investors. The EUR/USD rate continued to rise throughout the week, reaching 1.1643 on August 27.
These developments underscore the complex interplay of global economic factors, including central bank policies, inflation expectations, and geopolitical events, in shaping currency market dynamics during this period.
Commodities
| Name | 15/08/25 | 31/07/25 | 30/06/25 | 31/12/24 |
|---|---|---|---|---|
| WTI Oil ($/barrel) | $62.80 | $69.26 | $65.11 | $71.72 |
| Brent Oil ($/barrel) | $65.85 | $72.53 | $67.61 | $74.64 |
| Gold ($/oz) | $3336.19 | $3289.93 | $3303.14 | $2624.50 |
| Natural Gas ($/mmBtu) | $2.92 | $3.11 | $3.46 | $3.63 |
Currency
| Name | 15/08/25 | 31/07/25 | 30/06/25 | 31/12/24 |
|---|---|---|---|---|
| Euro (€/$) | 1.1703 | 1.1415 | 1.1787 | 1.0354 |
| Pound (£/$) | 1.3554 | 1.3207 | 1.3732 | 1.2516 |
| Japanese Yen (¥/$) | 147.19 | 150.75 | 144.03 | 157.20 |
| Swiss Franc (CHF/€) | 0.9438 | 0.9274 | 0.9348 | 0.9401 |
| Chinese Yuan Renminbi (CNY/$) | 7.1845 | 7.2000 | 7.1638 | 7.2993 |
Index Valuations
Index Return
| Equities | 1 Week | MTD | QTD | YTD |
|---|---|---|---|---|
| S&P 500 | 0.99% | 1.81% | 4.09% | 10.54% |
| NASDAQ Composite | 0.83% | 2.40% | 6.22% | 12.45% |
| DJ Industrial Average | 1.79% | 1.91% | 2.08% | 6.72% |
| S&P 400 | 1.59% | 0.75% | 2.38% | 2.58% |
| Russell 2000 | 3.12% | 3.47% | 5.26% | 3.38% |
| S&P 500 Equal Weight | 1.53% | 1.23% | 2.22% | 7.14% |
| STOXX Europe 50 (€) | 1.89% | 2.46% | 2.94% | 14.34% |
| STOXX Europe 600 (€) | 1.29% | 1.55% | 2.55% | 12.22% |
| MSCI EAFE Small Cap | 0.95% | 3.99% | 3.91% | 25.99% |
| FTSE 100 (£) | 0.80% | 0.60% | 4.95% | 14.87% |
| FTSE MIB (€) | 2.47% | 4.07% | 7.56% | 29.48% |
| CAC 40 (€) | 2.33% | 1.95% | 3.45% | 10.50% |
| DAX (€) | 0.81% | 1.22% | 1.88% | 22.35% |
| SWISS MKT (CHF) | 1.75% | 2.01% | 1.28% | 7.27% |
| TOPIX (¥) | 2.76% | 5.59% | 8.94% | 11.59% |
| Nifty 50 | 1.10% | -0.55% | -3.14% | 4.17% |
| Hang Seng (HKD) | 1.65% | 2.01% | 5.26% | 25.97% |
| MSCI World | 1.25% | 2.50% | 3.85% | 13.98% |
| MSCI China Free | 2.99% | 3.74% | 9.14% | 25.71% |
| MSCI EAFE | 2.37% | 4.91% | 3.46% | 24.10% |
| MSCI EM | 1.56% | 2.50% | 4.56% | 20.81% |
| MSCI Brazil (BRL) | 0.93% | 2.67% | -2.27% | 13.46% |
| MSCI India (INR) | 1.21% | -0.80% | -3.84% | 2.10% |
Fixed Income
| Name | 1 Week | MTD | QTD | YTD |
|---|---|---|---|---|
| Bloomberg US Aggregate | -0.02% | 0.61% | 0.34% | 4.38% |
| Bloomberg Euro Aggregate | 0.04% | 1.97% | -0.57% | 13.66% |
| Bloomberg US High Yield | 0.27% | 0.53% | 0.98% | 5.59% |
| Bloomberg Euro High Yield (€) | 0.32% | 0.43% | 1.58% | 3.91% |
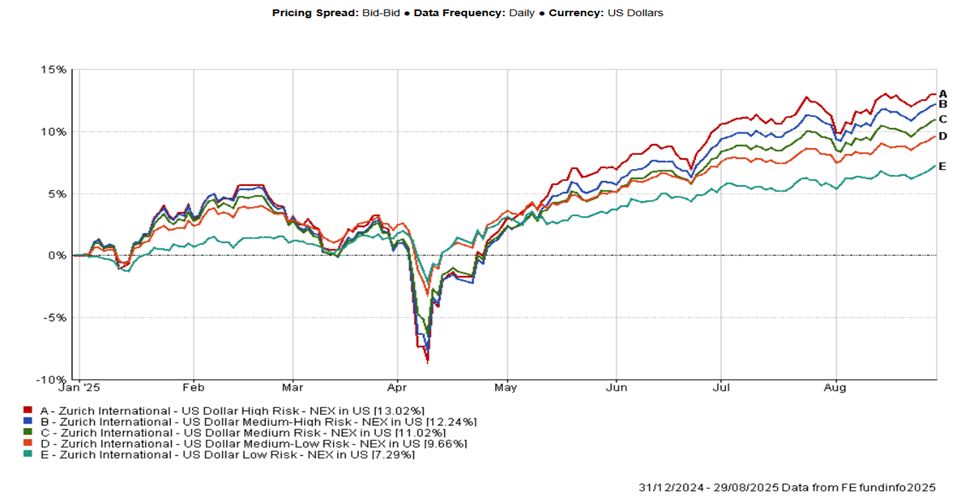
Blend Fund Performance Year To Date
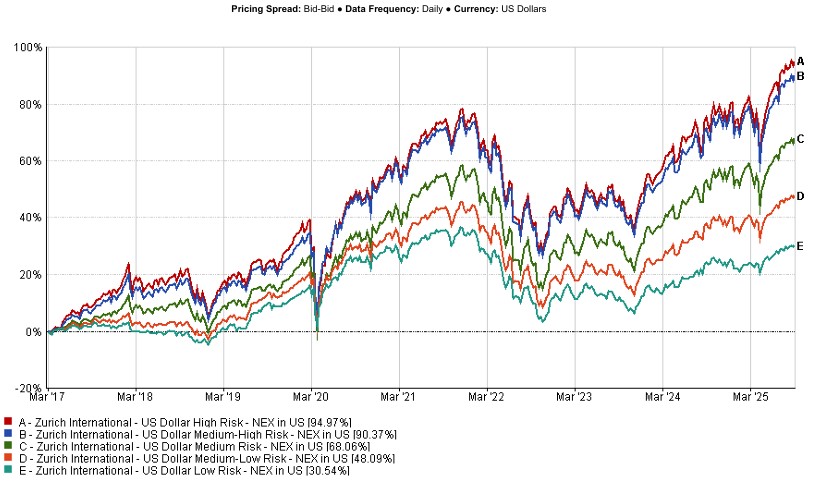
Blend Fund Performance Since Inception
Direct Fund
| (22/08/25) | 1 week % | 1 month % | 6 months % | YTD % | 1 year % | 2 years % |
|---|---|---|---|---|---|---|
| Aditum Global Discovery | -0.08% | 0.73% | 4.97% | 9.65% | 6.43% | 26.50% |
| Ashoka WhiteOak India Opportunities | 0.41% | -0.76% | 12.17% | -2.64% | -3.13% | - |
| BlackRock GF World Healthscience USD | 0.80% | 1.47% | -5.67% | 2.04% | -10.27% | 6.20% |
| Emirates Global Sukuk | 0.24% | 1.28% | 3.94% | 4.71% | 3.96% | 10.84% |
| Emirates MENA Fixed Income | 0.36% | 2.01% | 4.60% | 5.64% | 3.36% | 13.66% |
| Emirates MENA Top Companies | 0.21% | 0.76% | -0.44% | 2.99% | 5.85% | 4.63% |
| Franklin Gold and Precious Metals USD | 2.05% | 6.98% | 49.69% | 80.66% | 64.51% | 126.09% |
| Harris Associates Global Equity | 1.51% | -0.61% | 6.62% | 13.69% | 9.17% | 20.08% |
| Loomis Sayles Global Growth Equity | 0.81% | 2.56% | 8.10% | 16.16% | 26.14% | 57.91% |
| Loomis Sayles Multisector Income | 0.29% | 1.06% | 4.14% | 5.62% | 5.88% | 17.53% |
| PineBridge Japan Small Cap Equity | 1.47% | 4.06% | 19.39% | 23.29% | 15.27% | 17.05% |
| UBAM 30 Global Leaders Equity | -0.40% | 0.50% | 3.87% | 7.36% | 4.43% | 22.28% |
| iShares US Corporate bond Index | 0.36% | 1.31% | 3.89% | 5.21% | 3.91% | 15.51% |
| iShares Developed World Index | 0.46% | 3.01% | 10.06% | 13.90% | 17.91% | 48.58% |
Zurich Managed Funds
| (22/08/25) | 1 week % | 1 month % | 6 months % | YTD % | 1 year % | 2 years % |
|---|---|---|---|---|---|---|
| US dollar Adventurous | -1.11% | 1.18% | 6.36% | 11.93% | 9.55% | 32.76% |
| US dollar Performance | -0.94% | 0.72% | 3.49% | 6.47% | 6.22% | 23.89% |
| US dollar Blue Chip | -1.07% | 1.03% | 4.64% | 8.90% | 8.58% | 29.52% |
| US dollar Cautious | -0.69% | 0.68% | 3.13% | 5.25% | 4.09% | 17.62% |
| US dollar Defensive | -0.46% | 0.66% | 3.09% | 4.57% | 2.20% | 12.35% |
Zurich Mirror Funds
| (22/08/25) | 1 week % | 1 month % | 6 months % | YTD % | 1 year % | 2 years % |
|---|---|---|---|---|---|---|
| Canaccord Genuity Balanced | -0.50% | 0.68% | 3.14% | 5.89% | 4.75% | 20.48% |
| Canaccord Genuity Growth | -0.68% | 0.86% | 3.30% | 6.33% | 5.46% | 23.16% |
| Canaccord Genuity Opportunity | -0.52% | 1.16% | 4.16% | 8.31% | 9.31% | 28.96% |
| Emirates Emerging Market Debt | -0.19% | 2.63% | 2.82% | 4.53% | 5.72% | 22.62% |
| Emirates Islamic Balanced Managed | 0.15% | 1.51% | 3.41% | 5.55% | 5.14% | 17.08% |
| Loomis Sayles US Growth Equity | -1.92% | -0.98% | 2.58% | 5.60% | 18.99% | 53.42% |
* Data is lagged by 1 day.
** Data is lagged by 2 days.